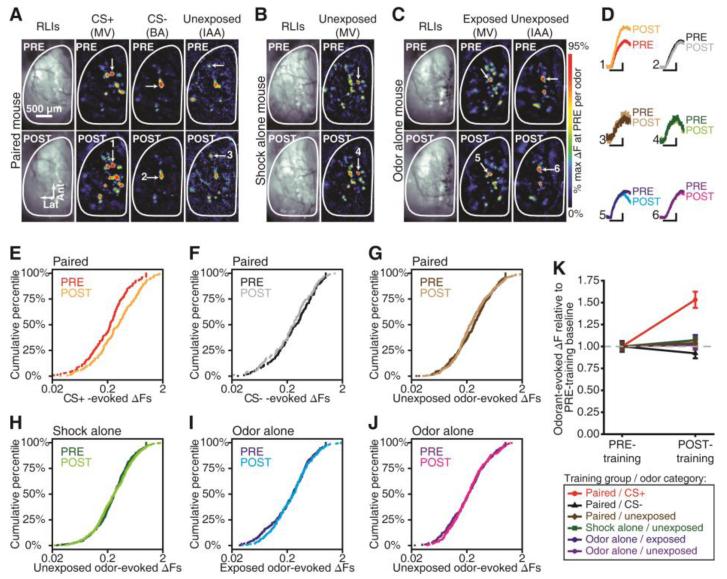
Fig. 2.
Fear learning-induced plasticity in odorant-evoked nerve output. (A-C) PRE vs. POST resting light images (RLIs) and pseudocolored difference maps from representative fear conditioned (A), shock alone (B), and odor alone (C) mice. MV, methyl valerate; BA, butyl acetate; IAA, isoamyl acetate. (D) Odorant-evoked change in fluorescence (ΔF) corresponding to callouts in A-C. Scale bars, 6-sec stimulus, 25% max of PRE. (E-J) Cumulative probability plots showing the distributions of PRE vs. POST ΔF values that were evoked by the CS+ (E; P ≤ 0.001), CS− (F; P > 0.05), and all other unexposed odorants (G; P > 0.05) in the paired group, all unexposed odorants in the shock alone group (H; P > 0.05), and all exposed (I; P > 0.05) and unexposed (J; P > 0.05) odorants in the odor alone group. P values are by K-S tests. (K) Mean±SEM ΔF pooled across glomeruli (dashed line, baseline). Number (N) of glomeruli contributing to data in E-K: paired, NPRE = 267, NPOST = 285; shock alone, NPRE = 163, NPOST = 173; odor alone, NPRE = 209, NPOST = 180.

