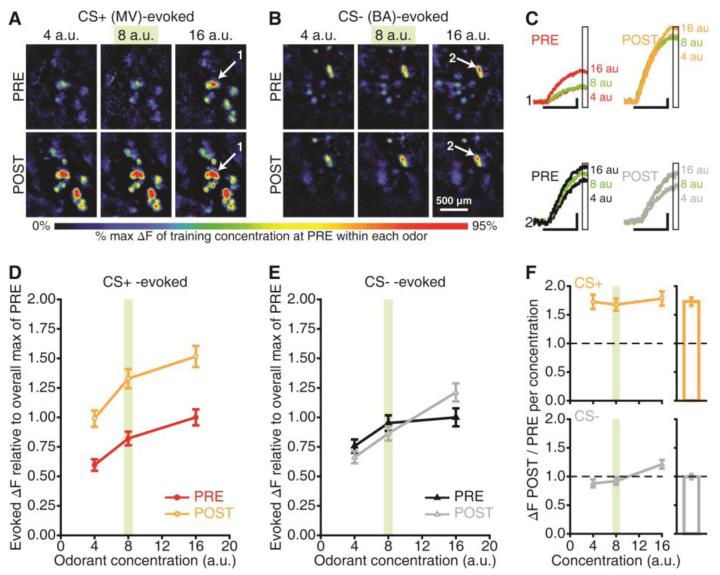
Fig. 4.
Enhanced sensitivity to the CS+. (A-B) Maps evoked by 3 concentrations (arbitrary units, a.u.) of the CS+ and CS− before and after this mouse underwent fear conditioning. MV, methyl valerate; BA, butyl acetate. (C) Response amplitudes (ΔFs) for callouts (A-B). Scale bars, 6-sec stimulus, 25% max of PRE. Boxed regions indicate the bin used to generate peak maps (A-B) and concentration analyses (D-F). (D-E) PRE vs. POST CS+- and CS−-evoked concentration-response functions. (F) Ratio of CS+- and CS−-evoked ΔFs during POST / PRE per concentration (dashed lines, baseline). Outsets are scaled to the main y-axis and show overall ratios pooled across concentrations. Data are pooled across glomeruli (mean±SEM) in D-F. The training concentration is indicated in green in A-F.

