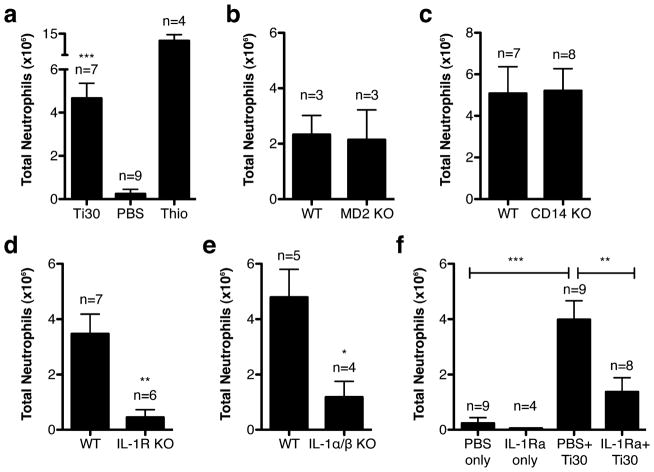
Figure 1.
Neutrophil recruitment following titanium injections in various mouse strains. (a) WT (b) MD2 KO (c) CD14 KO (d) IL-1R KO and (e) IL-1α/β KO. (f) Effect of IL-1Ra treatment on neutrophil recruitment. Graphs show the mean ± s.e.m. from the total number of mice indicated. P-values are shown as *** ≤ 0.0001; ** < 0.01; * < 0.05

