
Fig. 4.
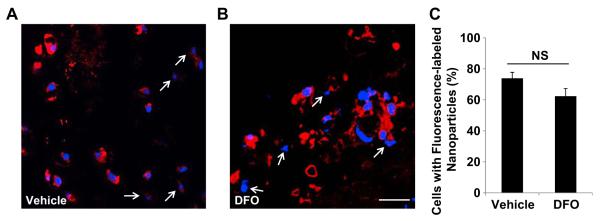
Subepithelial cellular localization of nanoparticle formulations. A and B. Confocal microscopy images showing the subepithelial cellular distribution of vehicle alone nanoparticles (A) and DFO nanoparticles (B). C. Quantification of cellular nanoparticle localization by percentage of cells with cytoplasmic fluorescence. Red: Rhodamine-labeled DSPE-PEG identifies the lipid vehicles of the nanoparticles; blue: nuclear staining by DAPI. White arrows: cells with no cytoplasmic fluorescent signal. Data are shown as means ± S.E.M. NS, not significant, Student’s t test (C). Scale Bar: 20 μm (A, B). (For interpretation of the references to color in this figure legend, the reader is referred to the web version of this article.)