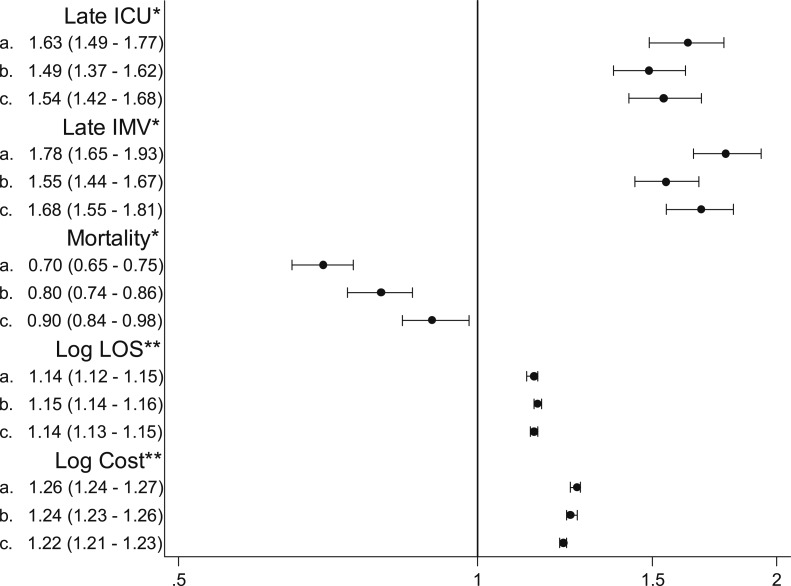
Figure 2.
ORs and risk ratios for the association between OSA and patient outcomes. All models account for clustering of patients in hospitals. a: Unadjusted; b: Adjusted for demographics, admitting physician specialty, and hospital characteristics; c: Adjusted for health-care-associated pneumonia vs community-acquired pneumonia, demographics, admitting physician specialty, hospital characteristics, and comorbidities. *OR (95% CI). **Risk ratio (95% CI) among survivors. IMV = invasive mechanical ventilation. See Figure 1 legend for expansion of other abbreviation.

