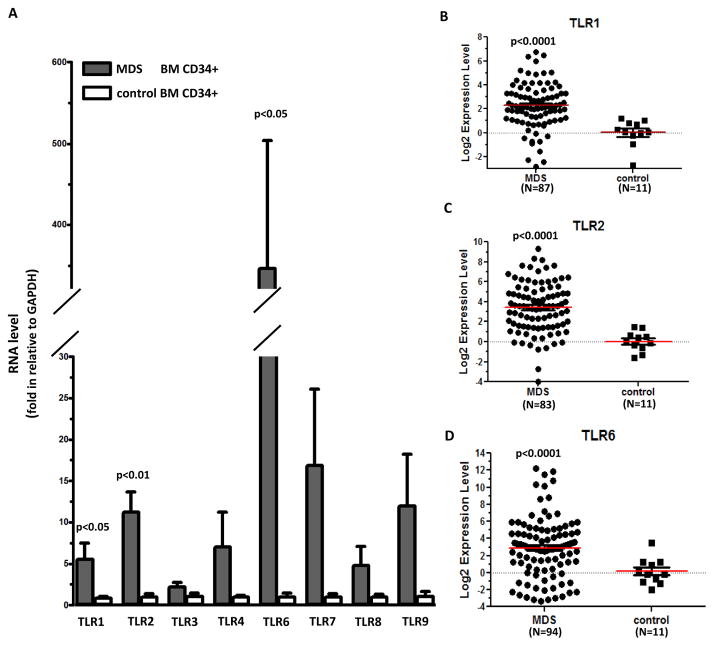
Figure 1. TLR RNA expression in primary MDS bone marrow CD34+ cells.
(a) Q-RTPCR analysis of RNA expression of 8 TLR genes in MDS and control BM CD34+ cells. (b–d) Logarithmic representation of Q-RTPCR results of TLR1, 2, and 6 in MDS and control CD34+ cells. Numbers of samples with evaluable RNA expression are marked underneath of each graph.

