Figure 8.
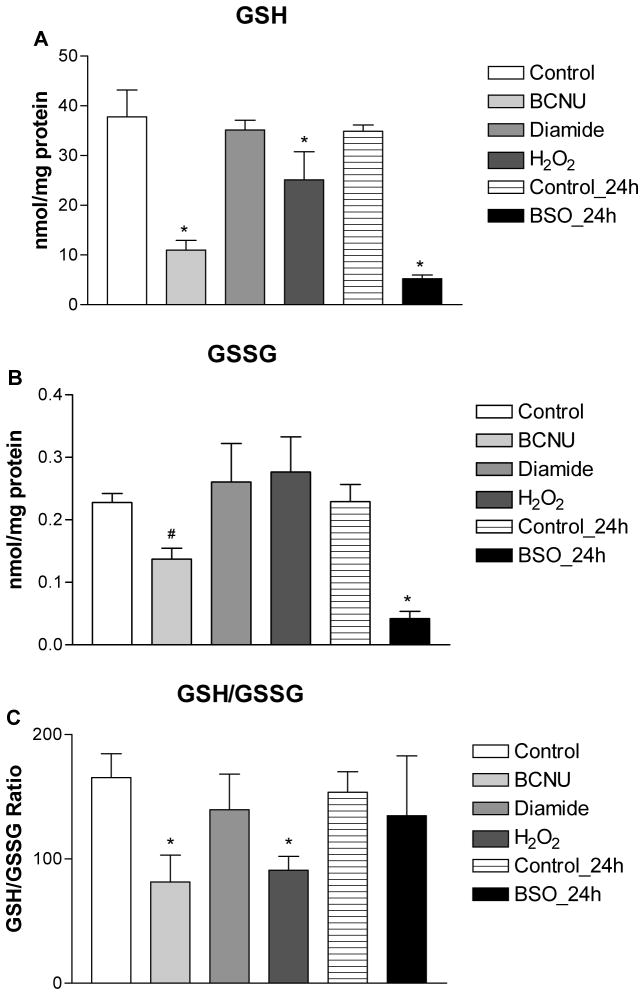
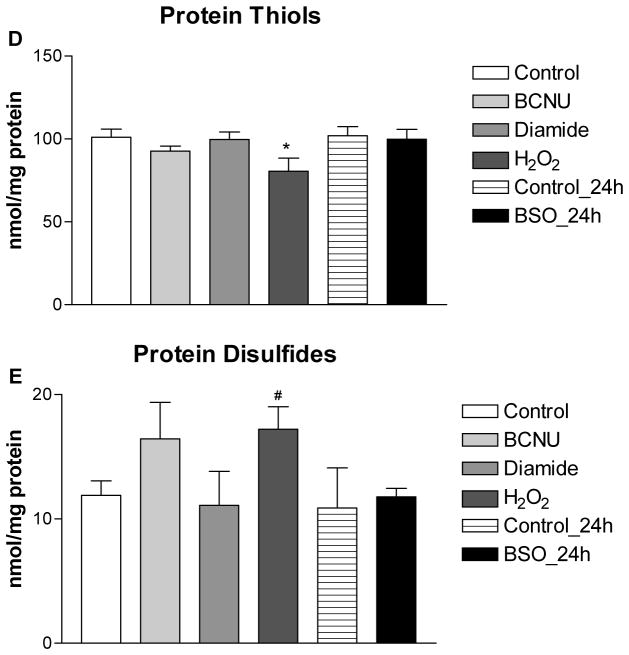
Intracellular GSH (A), GSSG (B), GSH/GSSG (C), protein thiols (D), protein disulfides (E) in the control and H2O2, diamide, BSO and BCNU treated H9c2 cells. The data are presented as nmol/mg protein and expressed as the means ± SD of three independent experiments. One-way ANOVA and Tukey’s post hoc test were performed to analyze data at each time point. # p < 0.05 and * p < 0.01 compared with control group.


