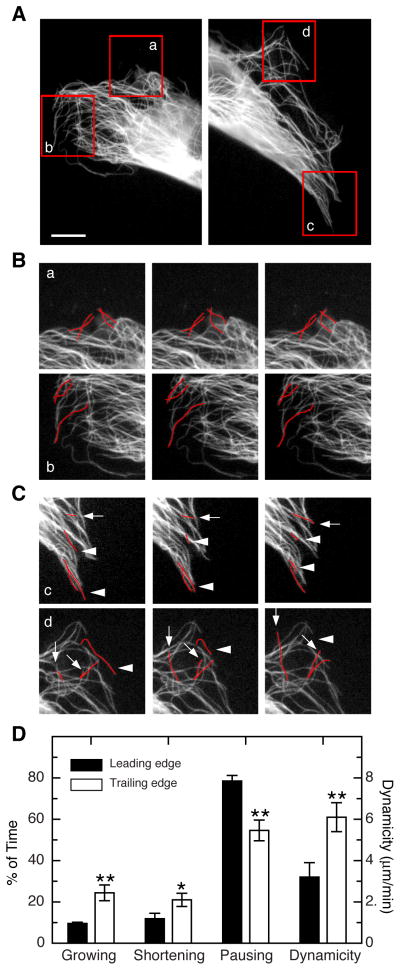
Figure 3. Asymmetric distribution of dynamic microtubules.
(A) HUVEC cell migrating into a scratch wound. The cell was transfected with EGFP-MAP4 to visualize the microtubules. Left panel shows the leading edge and the right panel shows the trailing edge. Areas that were monitored by time lapse are outlined in red. Scale bar = 7 μm. (B) Time lapse sequences of regions a and b from the leading edge. Photographs shown are 10 s apart. A few microtubules are traced in red to aid the viewer. (C) Time lapse sequences of regions c and d from the trailing edge. Photographs shown are 10 s apart. In contrast to the static microtubules at the leading edge, many of the microtubules in the trailing edge were seen to grow (arrows) or shorten (arrowheads). (D) Quantification of the percent of the time microtubules were growing, shortening, or pausing at the leading or trailing edges of the cell. The calculated dynamicity of the microtubules is also plotted on a separate scale. All the differences shown between the leading and trailing edges were found to be significant. *p < 0.05; **p < 0.01.

