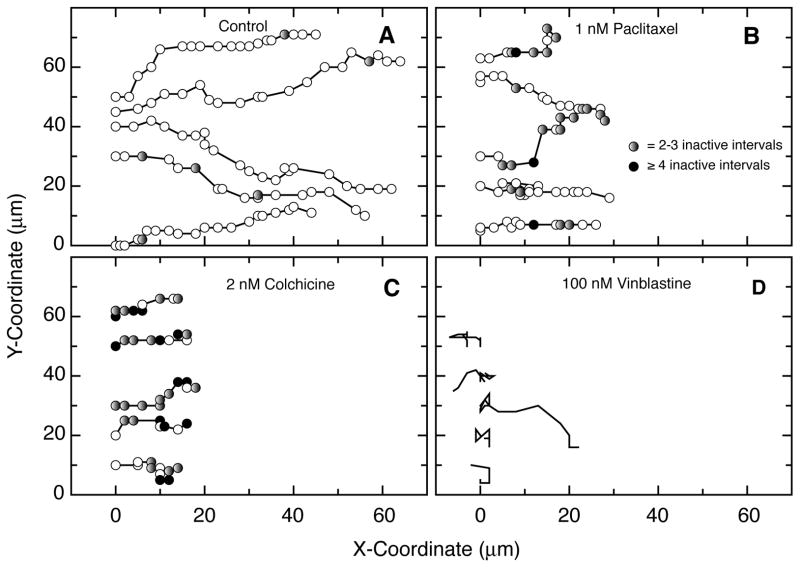
Figure 5. Migration paths of individual cells.
Time lapse movies of HUVEC moving into a scratch wound were analyzed by plotting the nuclear positions of individual cells at 15 min intervals. The direction of the wound is towards the right. (A) Untreated cells. Circles represent the position of the nucleus at time zero and every 15 min thereafter. (B) Cells treated with 1 nM paclitaxel to suppress microtubule dynamics. Shaded circles indicate the lack of any movement for one or more 15 min intervals. Gray, no change in position for 2–3 15-min intervals; black, no change in position for 4 or more 15-min intervals. (C) Cells treated with 2 nM colchicine to suppress microtubule dynamics. Shaded circles have the same meaning as in the previous panel. (D) Cells treated with 100 nM vinblastine to eliminate the microtubules. Circles were omitted because of extensive overlap.

