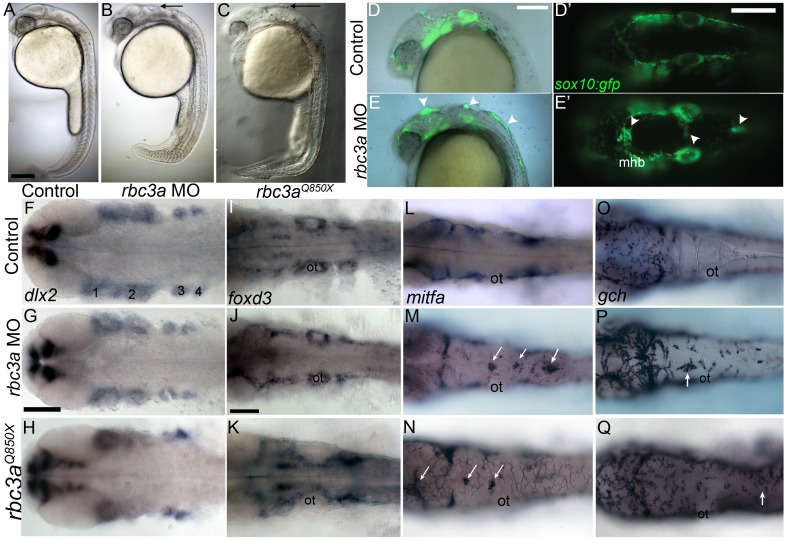
Figure 2. Rbc3a loss of function disrupts NC migration.
(A–C) Live 24 hpf controls (A), rbc3a-MO1–injected (B), and rbc3aQ850X mutant (C) embryos. Morphant/mutant morphological defects include the mhb and cell aggregates in the dorsal midline (black arrows in B and C). (D–E′) NC defects in live sox10:gfp transgenics injected with rbc3a-MO1. (D, E) Merged bright-field and fluorescent images of the cranial region at 24 hpf, lateral views, show GFP+ NC cells accumulated dorsally (white arrowheads). (D′, E′) Dorsal views showing midline position of aggregates over the mhb and further posteriorly (white arrowheads). (F–Q) Whole mount in situ hybridization for markers of different NC lineages in controls (row 1), rbc3a-MO1–injected (row 2), and rbc3aQ850X mutants (row 3) at 28 hpf, dorsal views, anterior to the left. dlx2 (F–H) expression in skeletogenic NC and foxd3 (I–K) expression in gliogenic NC appear unaffected, while mitfa in presumptive melanocytes (L–N) and gch in xanthophores (O–Q) are expressed in dorsal midline aggregates in rbc3a morphants/mutants (white arrows). Abbreviations: 1–4, pharyngeal arches; ot, otic vesicle; mhb, midbrain-hindbrain boundary. Scale bars, 100 µm.

