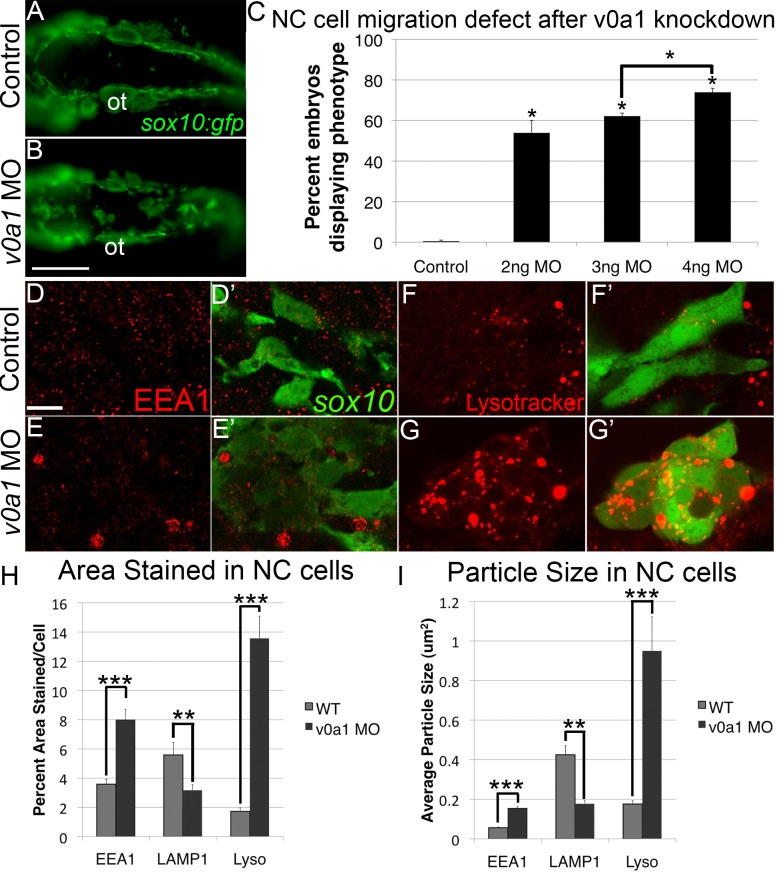
Figure 4. V0a1 knockdown disrupts NC migration and early endosome maturation.
(A, B) Fluorescent images of live sox10:gfp embryos at 24 hpf, dorsal views, showing aggregates of GFP+ cells in the dorsal midline. Ot, otic vesicle. Scale bar, 100 µm. (C) Percentages of embryos with GFP+ aggregates in embryos injected with increasing amounts of v0a1-MO. (D–E′) EEA1 staining (red) in sox10:gfp+ NC cells (green), in controls (D, D′), and v0a1-deficient embryos (E, E′) showing EEA1+ vesicle enlargement at 24 hpf. Scale bar, 10 µm. (F–G′) Lysotracker staining (red) in sox10:gfp+ NC cells in controls (F, F′) and V0a1-deficient embryos (G, G′) showing enlarged acidic intracellular compartments in NC cells. (H, I) Automated quantification of average % area (H) and average particle size (I) per NC cell stained positive for EEA1, LAMP1, or Lysotracker Red (Lyso) using ImageJ Particle Analyzer. V0a1 knockdown produced significantly higher EEA1+ and Lysotracker+ relative area and average particle size but significantly less LAMP1+ relative area and particle size per NC cell. Error bars represent ± SEM. * p<0.05, ** p<0.001, *** p<0.0001.

