
Figure 2. Imaging of CTL and KC targets.
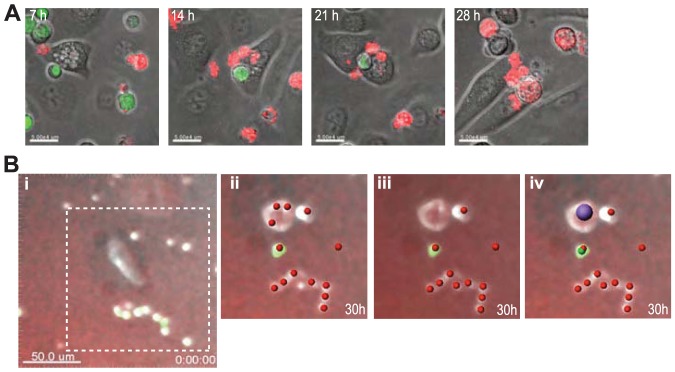
A. Series of still confocal microscopic images from Movie S1 of a single field over 30 hours. CD8+ T cells (green) attach to KC after 7 h of co-culture and cause apoptosis (red) at 21 h. Overlay images were from brightfield and fluorescence channels, acquired using a ×25 objective lens, mean intensity projection of a Z-stack of 5 confocal images of 2 µm each. (Bar, 50 µm) B. Analysis of epifluorescent imaging of CTL and KC co-cultures by software spot detection. Merged views of brightfield, rhodamine filter and GFP filter are shown in each frame at time 0 (i) and at 18 h (ii–iv). i. At t = 0, a KC and several smaller green T cells can be seen. ii. Spot detection without correction, using parameters: Red+, size 7 µm. iii. Spot detection after manual correction for adjacent spots. iv. Spot detection using parameters: Green+, size 7 µm (green); red channel+, size 7 µm (red); and including Red+, size 15 µm (purple).