
Figure 7. Velocity of a CTL directly correlates with its ability to kill.
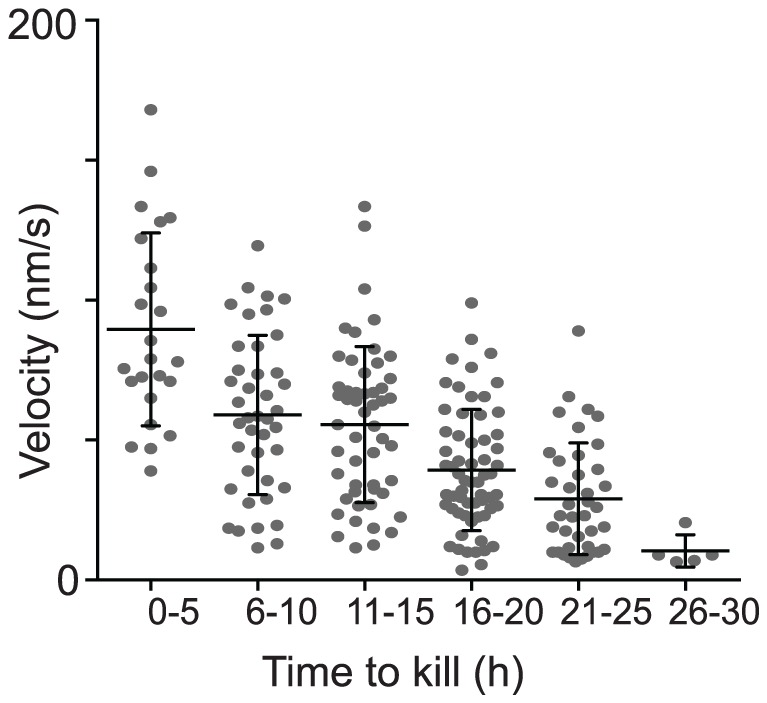
CTL were isolated from OVA-immunised mice and underwent short stimulation with antigen in vitro before adding to KC monolayers loaded with SIINFEKL and imaged for 30 h. Movies were examined in 5-hour time intervals to analyse target cell death in that time frame, and its killer CTL identified. If more than one CTL was attached to a dying KC, both were analysed. The average track velocity for each identified CTL in each time interval was determined. CTL which were not moving, were excluded. Pooled results N = 3 independent experiments. Mean and SD are shown.