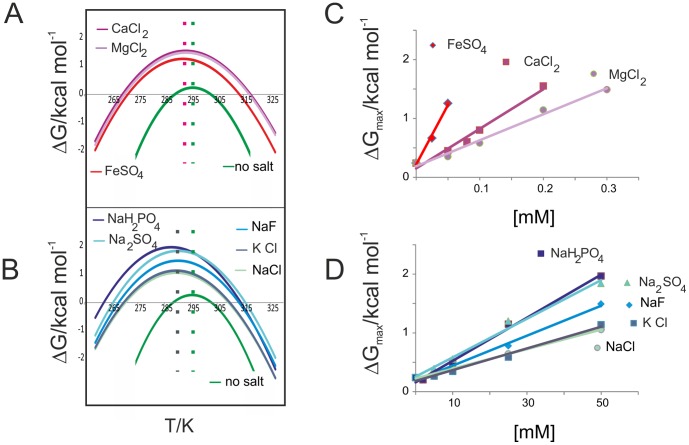
Figure 3. Stability curves and thermodynamic parameters.
A) Comparison of the stability curves for Yfh1 in HEPES alone (no salt) and in the presence of three representative salts of divalent cations at concentrations that yield the maximum value of ΔG. The dotted lines show average values of TS. B) Comparison of the stability curves for Yfh1 in HEPES alone (no salt) and in the presence of five representative salts of monovalent cations at concentrations that yield the maximum value of ΔG. The dotted lines show average values of TS. C) Dependence of ΔGmax for divalent cations as a function of concentration. D) ΔGmax for all anions as a function of concentration.

