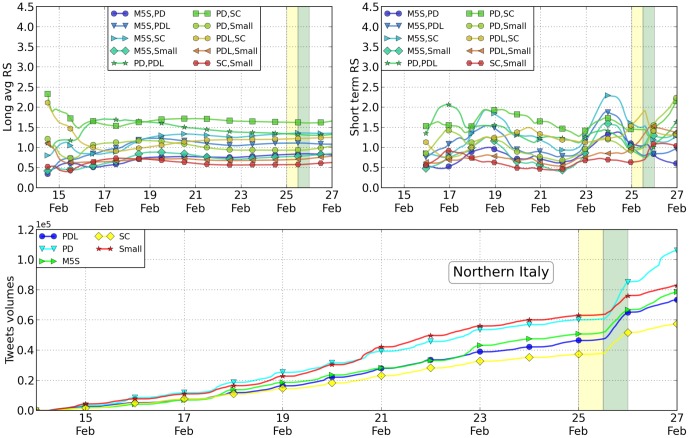
Figure 4. Relative Support from the Twitter volumes, Northern Italy.
For the case of the the macro-area Northern Italy, top left: the plot of the RS parameter computed on an average of 10 days centered on the specific day on the x-axis; top right: the values of the RS parameters with no averaging day after day. The parties have been ordered according to their final rank at the elections at the national scale. Since parties ranking differ locally, some of the plots are actually below 1. Below we have a detailed plot of the tweet volume in the final days before the elections, where changes of linear slopes are especially evident during voting days (yellow in all the figures).

