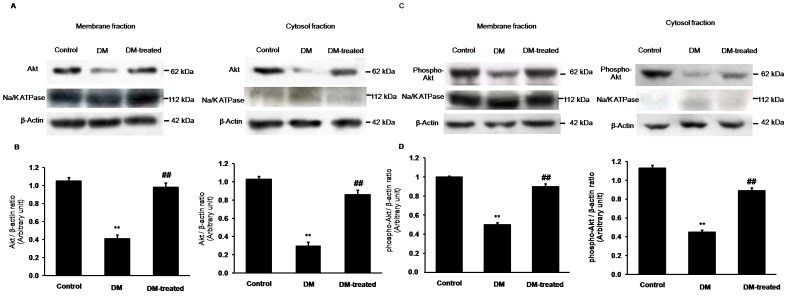
Figure 6. Effects of diabetes on Akt and phospho-Akt expressions in the renal cortex.
(A) and (C); Western blot analysis for Akt and phospho-Akt in the membrane and cytosolic fractions of renal cortical tissues in control, diabetic (DM) and diabetic with insulin-treated (DM-treated) rats, respectively. (B) and (D); The signal intensity of Akt and phospho-Akt in the membrane and cytosolic fractions normalized to β-actin, respectively. Na+-K+-ATPase and β-actin expressions were used as a membrane marker and loading control, respectively. Bar graphs indicate means ± SEM from five independent experiments. **p<0.01, compared to control; ## p<0.01, compared to diabetes.

