
Figure 2.
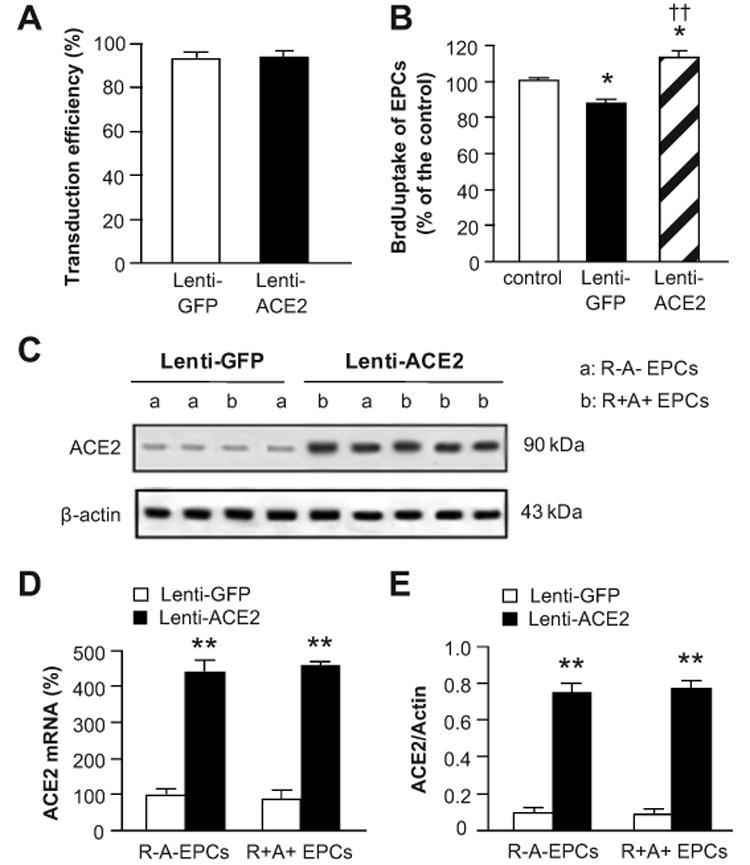
Transduction efficiency, proliferation rate and ACE2 expression in EPCs. A, Transduction efficiency of lentivirus in EPCs. B, Proliferation rate of control, and EPCs transuded with Lenti-GFP or Lenti-ACE2. *P<0.05 versus control; ††P<0.01 versus Lenti-GFP. C, Representative Western blot bands showing the ACE2 expression in EPCs. Summarized data of ACE2 expression in EPCs at mRNA (D) and protein (E) levels. **P<0.01 versus Lenti-GFP, n=6/group. Control: untransduced EPCs.