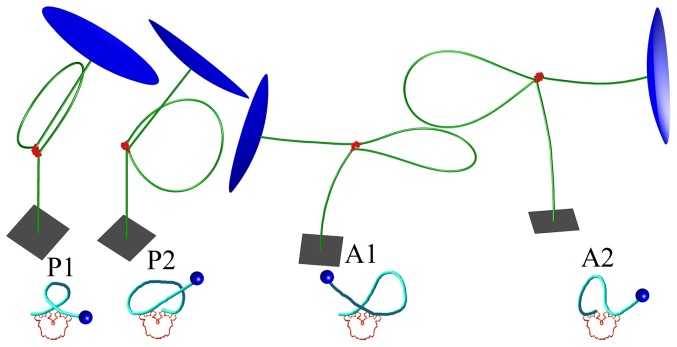
Figure 4. Minimum energy configurations of a 1632 bp segment in a TPM experiment.
The 900 bp loop formed between binding sites is located at  , and
, and  . Lac repressor is shown in red, part of the attachment plate is shown as a gray square, and part of the 160 nm bead surface is shown in blue. The sketch of the binding topology for each loop type is depicted in a diagram below.

