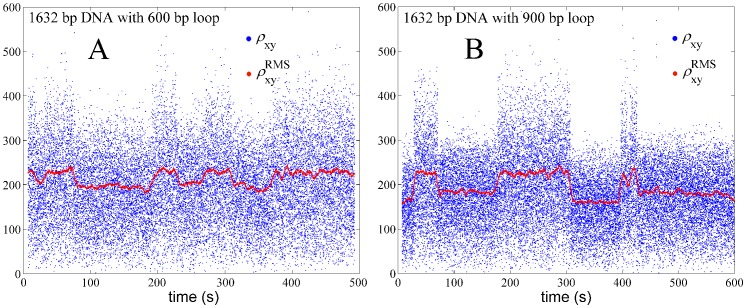
Figure 8. An example of our experimental results showing the projected end-to-end distance for experiments in which Lac repressor-induced loops were forming with length 600 (left) and 900 (right) bp.
The blue dots show the projected end-to-end distance  calculated using equation (32). The red dots, centered within each 8 s window, show the RMS values according to equation (33). Each pronounced drop in the red trace corresponds to a looping event.

