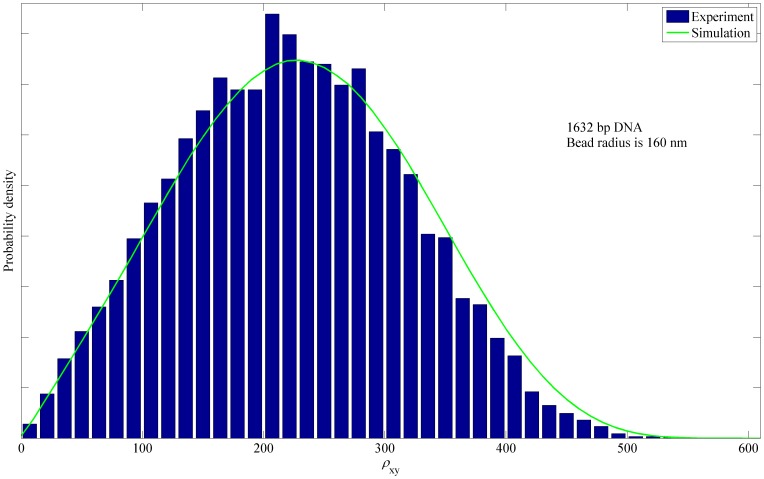
Figure 9. Experimental and simulated probability density of the projected distance for the 1632 bp DNA.
The probability density of the projected distance  between attached DNA end and bead center, as measured in our TPM experiments (blue bars) and computed by numerical simulation (green curve). The 1632 bp tethered DNA molecule is unlooped for the duration of this experiment. The bead radius is 160 nm.

