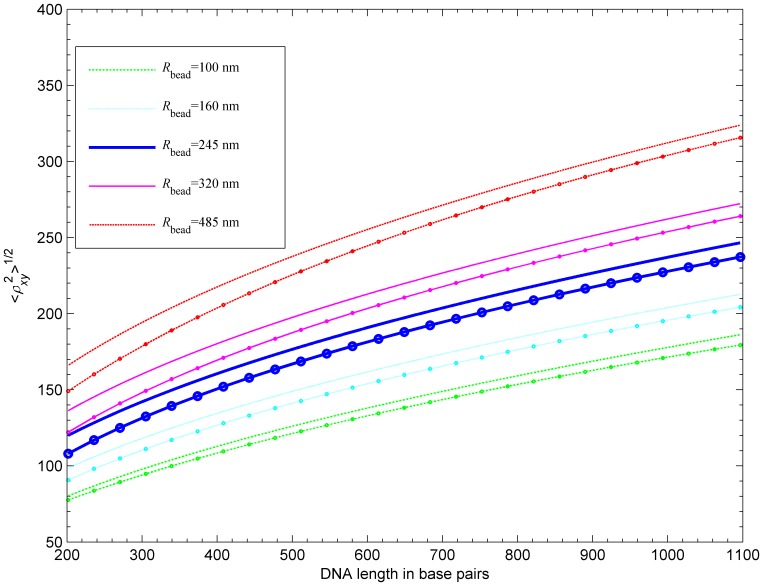
Figure 10. Calibration curves of the projected RMS distance (center of bead to attached end) for five bead radii.
For each bead radius, a curve based on the numerical fit given in [26] is shown (marked with circles) together with our calculated curve. Our model is based on homogeneous DNA segments with persistence length of 476  .
.

