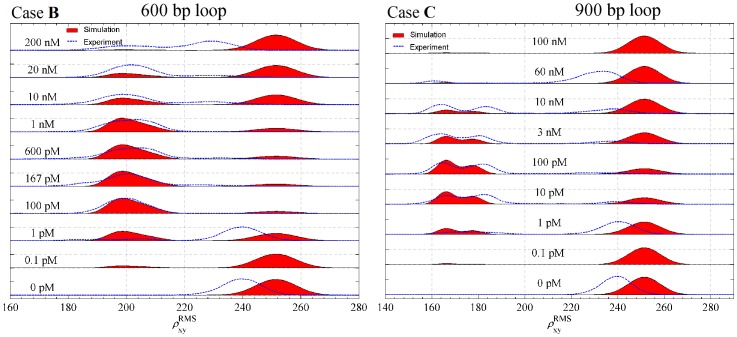
Figure 14. The predicted joint distribution of RMS projected distances as a function of the concentration of Lac repressor for the two cases of the 1632 bp DNA.
Computer simulation and Experimental TPM results showing a DNA molecule of 1632(Case B)  , and
, and  yielding 600 bp Lac repressor-induced loops; and (Case C)
  , and
, and  yielding 900 bp Lac repressor-induced loops. The bead radius for both cases is 160 nm. The figure shows the joint distribution of RMS projected distance between the center of the bead attached to the end for which
  to the DNA end that is attached to the plate. Each single RMS value in the experimental results (blue) was calculated using a time window of 8 s. The simulation results (red) were calculated from the probability density functions given in Figures 12B, and 12C and our calculated looping
  -factors (See Table 2).

