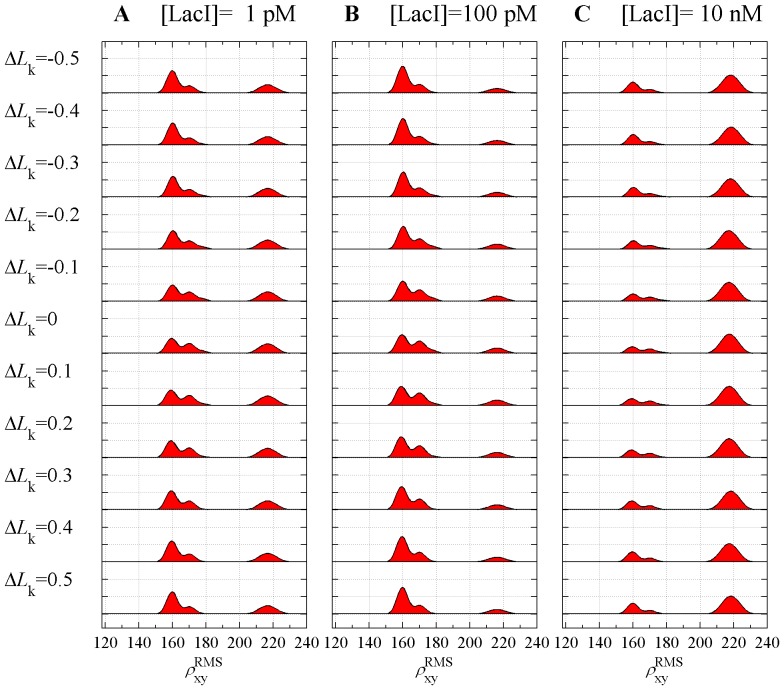
Figure 16. Joint distribution of RMS as a function of the excess link for three concentrations.
The predicted joint distribution of RMS projected distances,  , is shown as a function of the excess link,
  for the 900 bp DNA. The distribution was calculated from the probability density functions given in Figures 12A and 15, and the looping
  -factors. For each value of
  all configurations with values of
  differing by an integral number were taken into account.

