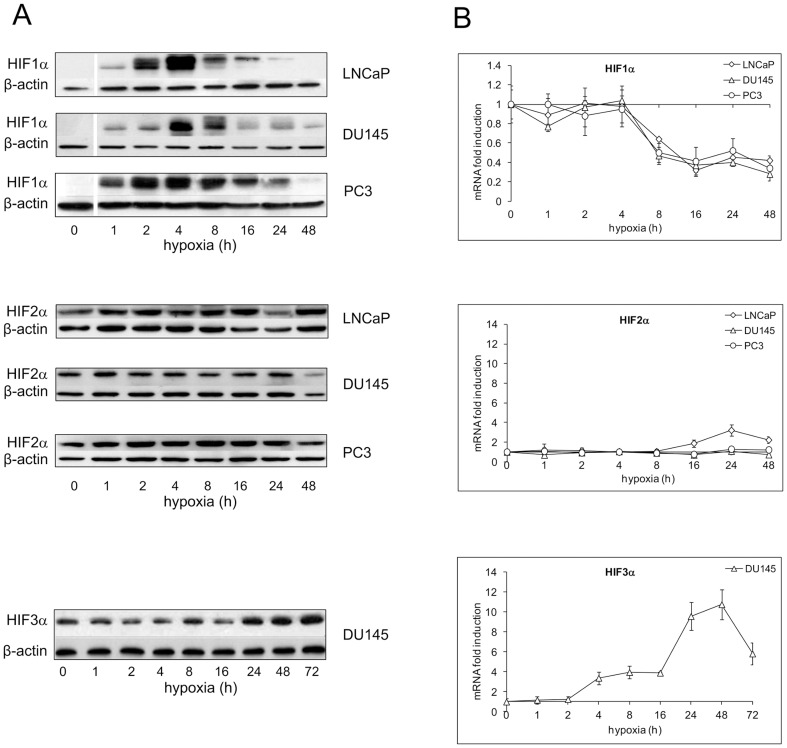
Figure 1. Time-course of hypoxia on HIF1α, HIF2α and HIF3α protein nuclear level and mRNA expression in LNCaP, DU145 and PC3 cells.
Cell were exposed to 1% O2 from 1 up to 48–72 h, according to the experimental design or left untreated. A Protein expression was detected in nuclear extracts by immunoblot analysis. A representative experiment for each gene in each studied cell lines is shown. β-actin was used as a loading control. B mRNA determinations were performed by real-time PCR, normalized to the housekeeping gene 18S rRNA and expressed as fold induction with respect to normoxic controls (set at 1). Mean values ± SE.

