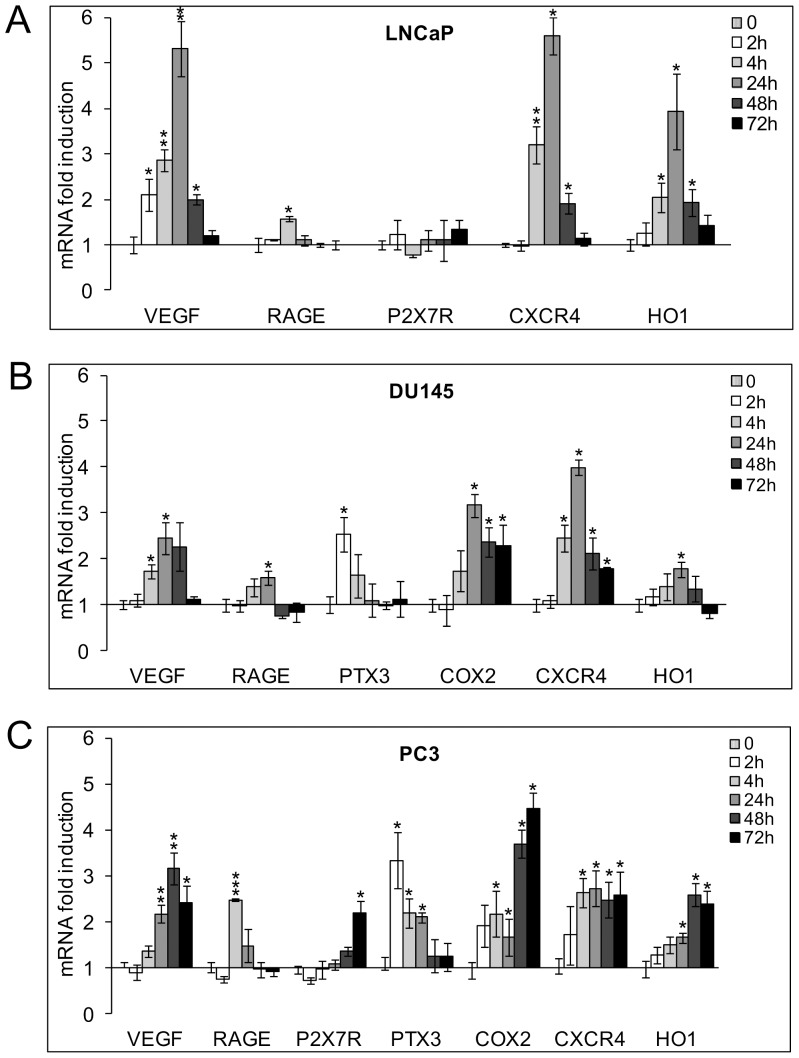
Figure 3. mRNA expression levels of pro-inflammatory genes in hypoxic LNCaP, DU145 and PC3 cells.
Cells were exposed to 1% O2 from 2 up to 72 h. mRNA levels for VEGF, RAGE, P2X7R, PTX3, COX2, CXCR4 and HO1 were analyzed by real-time PCR and normalized to the housekeeping gene 18S rRNA. Graphs show the ratio between the expression of hypoxia treated cells with respect to normoxic control cells (set at 1). Mean values ± SE. * Hypoxic cells vs normoxic control cells.

