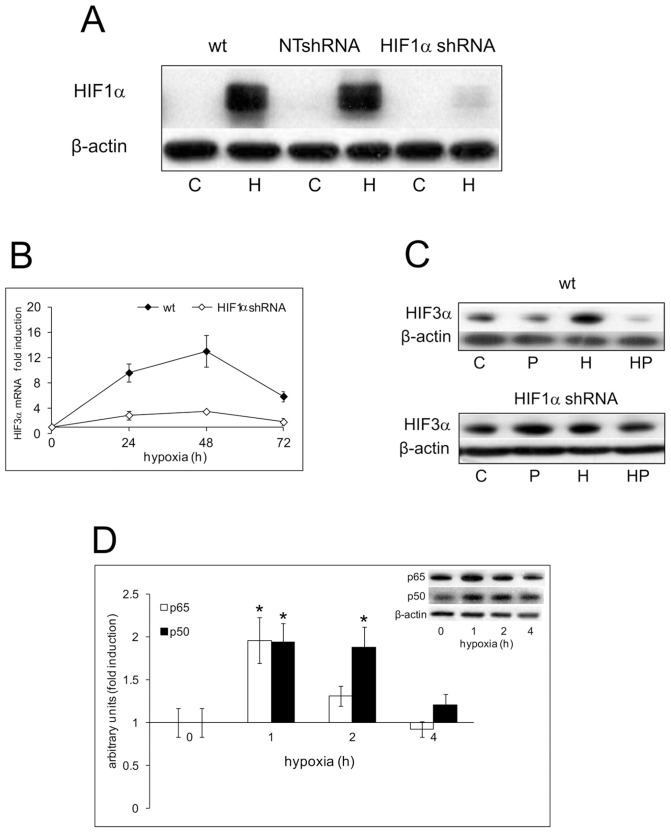
Figure 7. Effects of HIF1α knockdown on the hypoxic activation of HIF1α, HIF3α and of NF-kB in DU145 cells.
A Wild type, NTshRNA and HIF1α shRNA transfected DU145 cells were kept in normoxia and under hypoxia (1% O2) for 4 h. HIF1α content was measured in the nuclear fraction by immunoblot analysis. β-actin was used as a loading control. C: control normoxic untreated cells. H: hypoxic cells. B Wild type and HIF1α shRNA cells were kept in normoxia and under hypoxia for 24, 48 and 72 h. mRNA level for HIF3α was analyzed by real-time PCR and normalized to the housekeeping gene 18S rRNA. The graph shows the ratio between the expression in hypoxia treated cells with respect to normoxic control cell cultures (set at 1). Mean values ± SE. C Wild type and HIF1α shRNA cells were kept in normoxia and under hypoxia for 48 h in the presence and absence of 5 µM parthenolide. The content of HIF3α nuclear protein was detected by immunoblot analysis. β-actin was used as a loading control. C: control normoxic untreated cells. P: normoxic parthenolide treated cells. H: hypoxic cells. HP: parthenolide treated hypoxic cells. D HIF1α shRNA cells were kept in normoxia and under hypoxia for 1, 2 and 4 h. The nuclear content of p50 and p65 was detected by immunoblot analysis. β-actin was used as a loading control. Densitometric analysis of p50 and p65 relative to β-actin was expressed as arbitrary units and shown as fold induction with respect to normoxic control cell cultures (set at 1). Mean values ± SE. * Hypoxic HIF1α shRNA cells vs HIF1α shRNA normoxic control.

