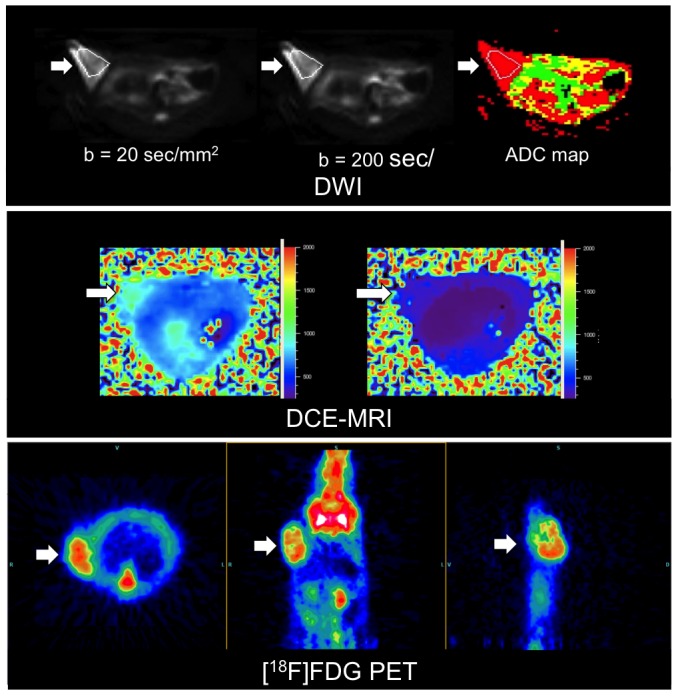
Figure 3. Representative DWI (transverse slices; b = 20, b = 200, ADC map), T1 map (T1 values are shown in color scale (ms)) of DCE-MRI from a single time point (transverse slices; pre and post i.v. injection of Gadolinium) used for T1 quantification and FDG-PET (from left to right: transverse, coronal and sagittal reconstruction) images of the A673 rhabdomyosarcoma xenografts (arrows) subcutaneously implanted in the right lateral flank.

