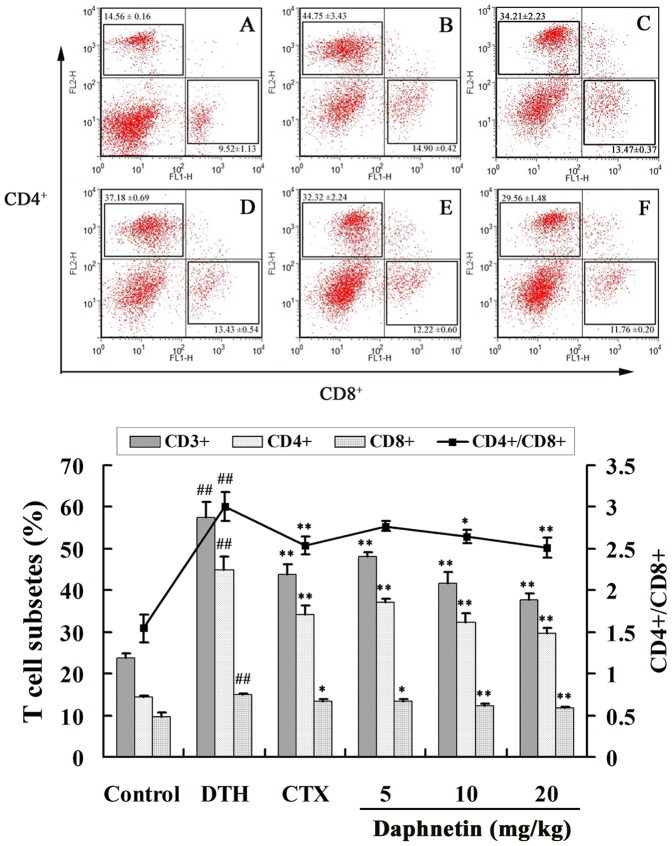
Figure 8. Flowcytometric evaluation of the effect of daphnetin on CD4 and CD8.
(A) Control group, (B) DTH group, (C) CTX group, (D) Daphnetin 5 mg/kg group, (E) Daphnetin 10 mg/kg group, (F) Daphnetin 20 mg/kg group. The results were from three independent experiments and presented as mean ± SD. ## P<0.01 vs. Control group. *P<0.05 or **P<0.01 vs. ConA group.

