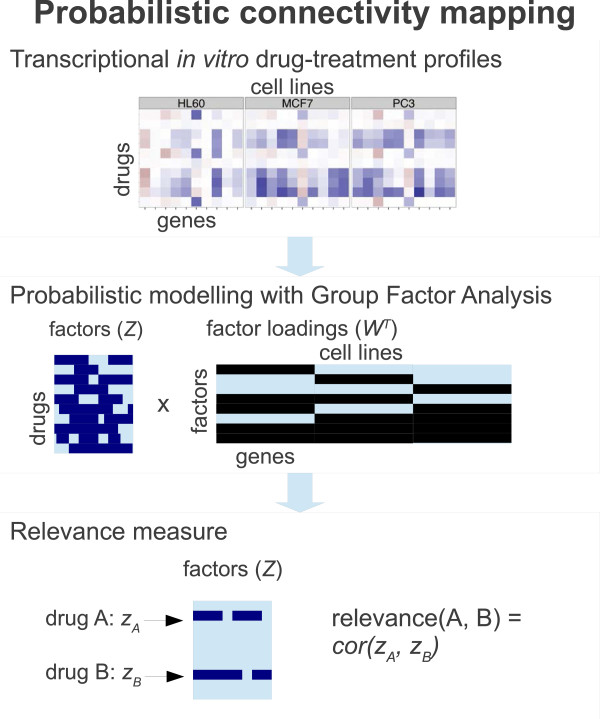
Figure 1.
Overview to probabilistic connectivity mapping. The input data for probabilistic connectivity mapping are a collection of drug-treatment gene expression profiles, measured on multiple cell lines. Probabilistic modeling, here Group Factor Analysis, is applied to explain the data in terms of a set of factors Z and their loadings W. The factors can be active in one or more cell lines, capturing both specific and shared drug response effects. For the probabilistic connectivity mapping, a relevance measure between two drugs is finally defined as a similarity of their factor activities zi, computed in practice as the Pearson correlation.

