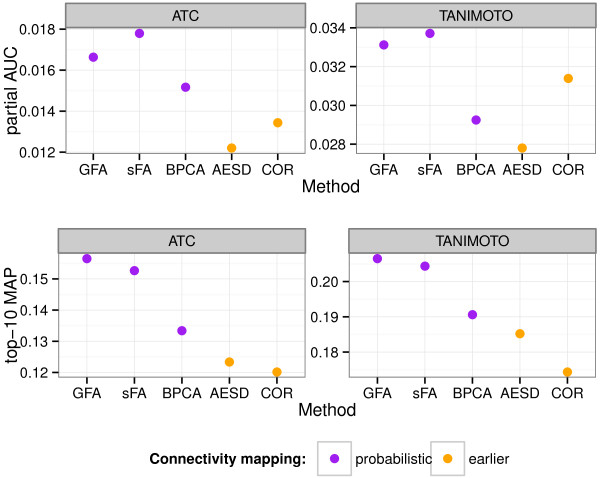
Figure 2.
Probabilistic connectivity mapping outperforms earlier alternatives in retrieving similar drugs. The retrieval performance is indicated with two goodness measures (top row: partial AUC, bottom row: top-10 MAP) and two ground truths (left: ATC codes, right: Tanimoto similarity of the 2D fingerprints of the drugs). Probabilistic connectivity mapping (purple color) is performed with three models: Group Factor Analysis (GFA), sparse factor analysis (sFA), and Bayesian PCA (BPCA). These are compared to two earlier connectivity mapping methods (orange color): rank-based average enrichment-score distance (AESD) and the Pearson correlation over the differential expression profiles (COR).

