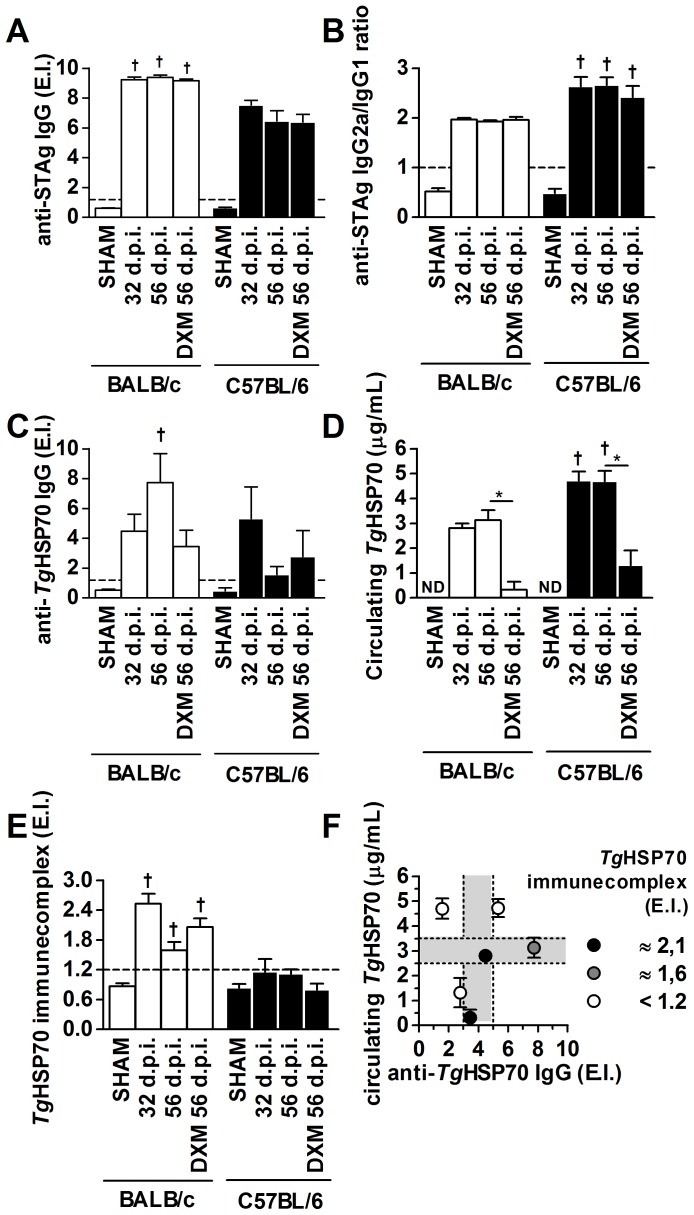
Figure 3. Serological detection of TgHSP70, specific antibodies and immune complexes in T. gondii infected animals.
Detection of anti-STAg IgG (A), anti-STAg IgG2a/IgG1 ratio (B), anti-TgHSP70 IgG (C), circulating TgHSP70 (D) and TgHSP70-specific ICs (E) in serum samples of BALB/c and C57BL/6 mice infected with T. gondii and/or treated with DXM. Serum samples were collected in different days p.i. as well as from uninfected/untreated mice (SHAM) and analyzed by ELISA. (F): Correlation among anti-TgHSP70 IgG (x axis), circulating TgHSP70(y axis) and TgHSP70-IgG IC (dots) obtained from both lineages of mice were analyzed for IC kinetics. Darker dots represent higher amounts of ICs shown in E. Optimal conditions (light grey area) for IC formation are represented. ND = non-detected. E.I. = ELISA index (refer to materials and methods section for details). E.I. values above 1.2 (dashed line in A, C, D and E) were considered positive. Data are representative of at least two independent experiments of 5 mice per group that provided similar results. *Significant differences between different treatment conditions within the same mouse lineage (ANOVA and Bonferroni multiple comparison post-test; *P<0.05); †Significant differences between the two mouse lineages submitted to the same treatment conditions (Student's t test; † P<0.05). d.p.i. = days post-infection.

