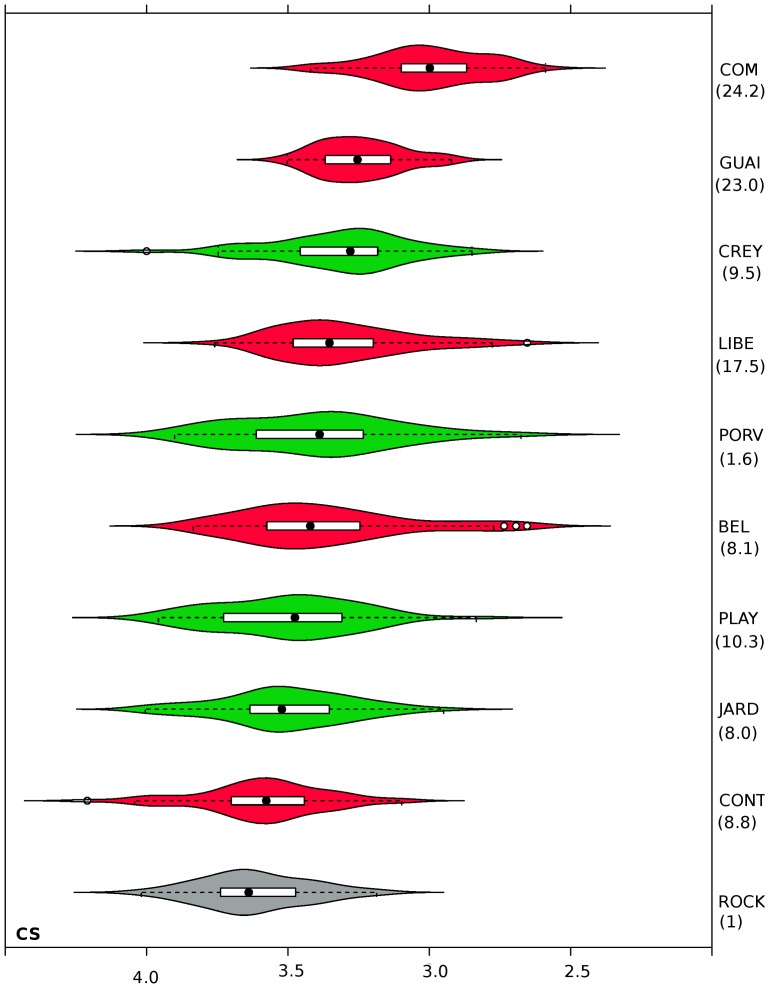
Figure 3. Wing size variation among Aedes aegypti isolates from field.
Violin plots enclose box plots. Each box is divided by the median (black circles), which top and bottom correspond to 25th and 75th quartiles, respectively. Isolates from Cúcuta are colored in red, and those from Quibdó in green. Between parentheses is the RR50 to lambda-cyhalothrin. CS: centroid-size.

