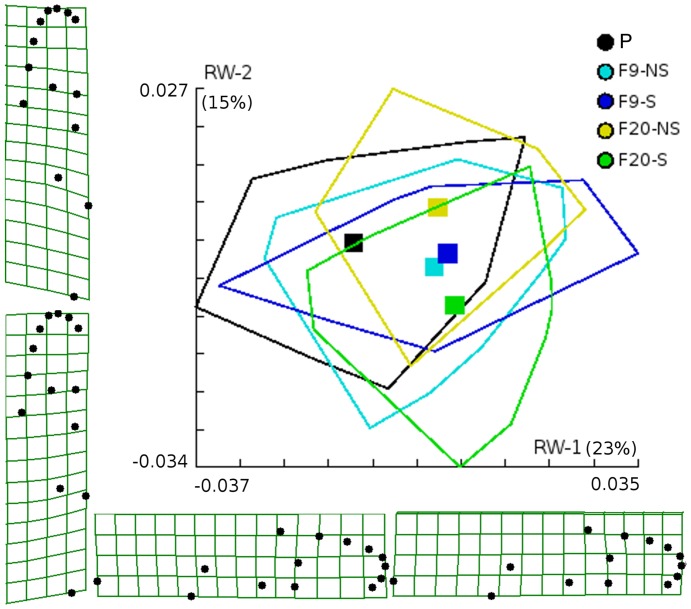
Figure 6. Scatterplot of the scores along the first two principal components (relative warps), the convex hull for each group and the average scores for each group.
Convex hulls enclose individuals from parental and its descendants at ninth and twenty generations which were ordered on the two first relative warps. Squares represent the centroids (average scores for each group). To easy viewing of the group's centroids, the individual positions are not shown. Deformation grids for the extreme values of the first and the second relative warps on the mean configuration, are also shown. P: parental Comuneros isolate; F9-NS and F20-NS: ninth and twenty generations non-selected for lambda-cyhalothrin resistance; F9-S and F20-S: ninth and twenty generations selected for lambda-cyhalothrin resistance. Sample-sizes were 51 parental females, 42 F9-NS, 49 F9-S, 50 F20-NS, and 56 F20-S.

