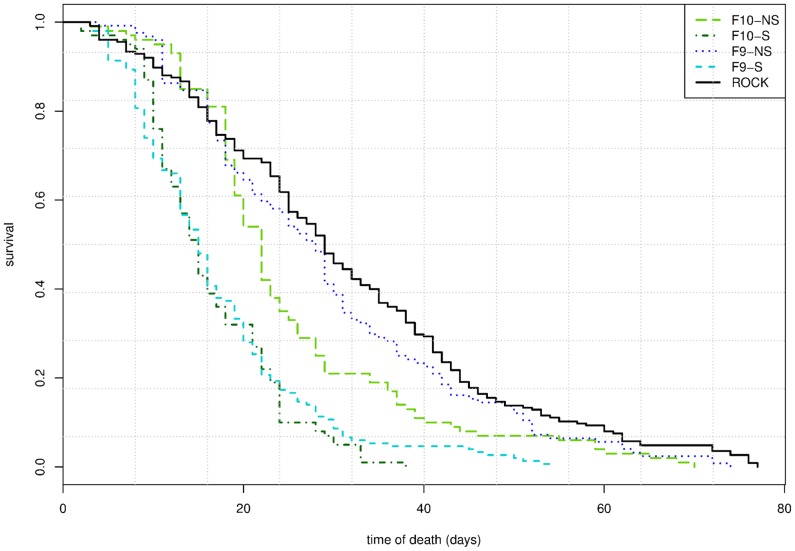
Figure 7. Survival analysis using Kaplan-Meier estimates.
Curves represent daily survival of the Rockefeller strain (ROCK) females, and the ninth (F9-S) and tenth (F10-S) generations of the lambda-cyhalothrin selected line from COM isolate, and the ninth (F9-NS) and tenth (F10-NS) generations of the non-selected line from the same isolate. Sample-sizes were 100 females for both F10-S and F10-NS, 124 for F9-NS, 150 for F9-S, and 225 for the ROCK strain.

