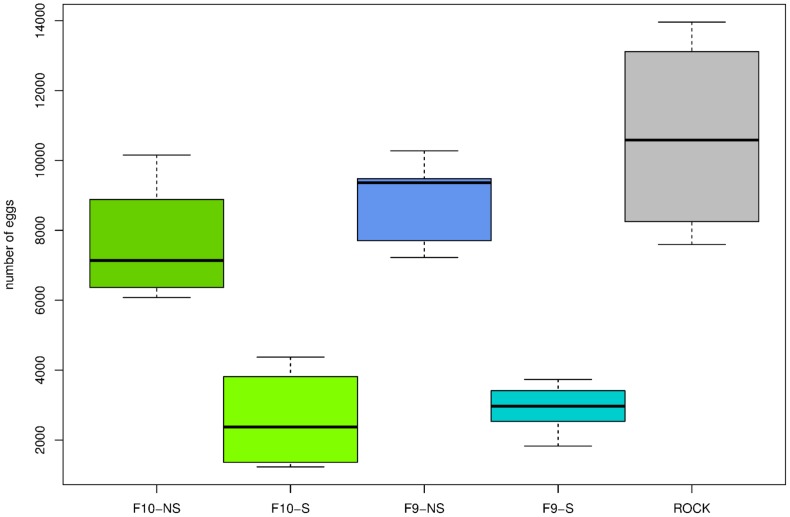
Figure 8. Box-plots showing the fecundity variation of both lambda-cyhalothrin selected and non-selected lines.
Each box is divided by the median, which top and bottom correspond to 25th and 75th quartiles, respectively. ROCK: the Rockefeller strain, F9-S and F10-S: the selected line at ninth and tenth generations, and F9-NS and F10-NS: the non-selected line at ninth and tenth generations. Sample-sizes were 100 females for both F10-S and F10-NS, 124 for F9-NS, 150 for F9-S, and 225 for the ROCK strain.

