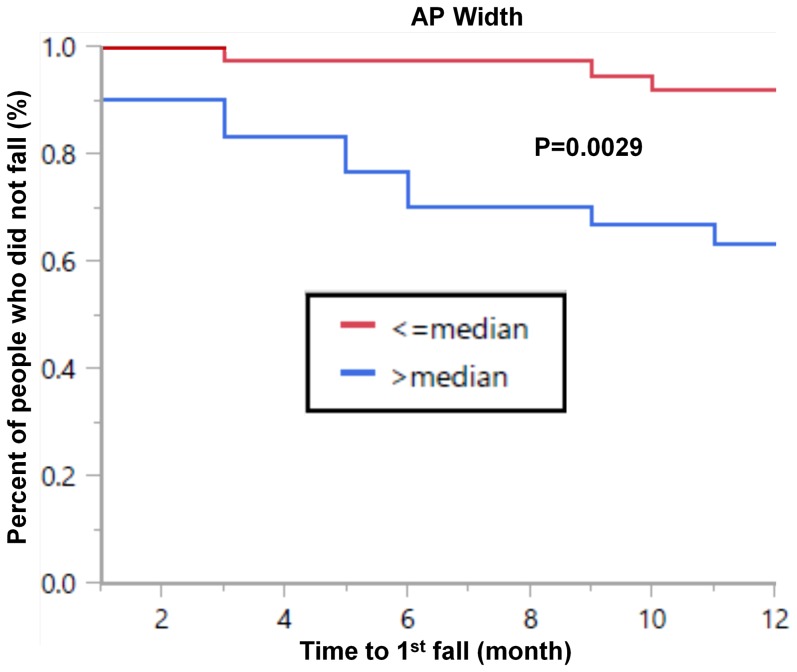
Figure 3. Survival curve showing the time to first fall among all subjects who reported no falls in the year prior to the study.
Based on fall history, all of these subjects had a relatively low risk of future falls. However, the anterior-posterior width of the peak in the frequency domain, a measure of gait variability derived from the 3-day recording, was associated with time to first fall. When subjects were classified as those having a relatively high (above the median) or low (below the median) width, those with a high width experienced a fall sooner (Log rank test: p = 0.0034, Wilcoxon test: p = 0.0029), compared to those with a relatively low width.

