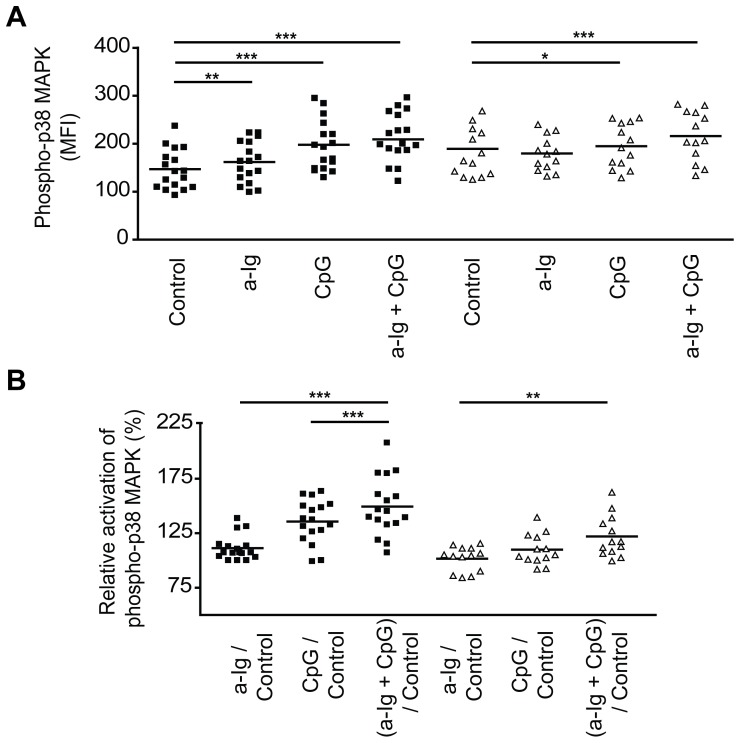
Figure 8. Phospho-flow analysis of p38 MAPK activation in resting and activated B cells from healthy blood donors and from RA patients.
PBMC (4×10⁶ cells) were left unstimulated (control) or stimulated with anti-Ig (7.5 µg/ml), CpG (4 µg/ml) or both agents for 30 min at 37°C. p38 phosphorylation was tested in the CD19+ CD27− naive B cell subset. (A) The activation of p38 MAPK in healthy (square; n = 17) and RA (triangle; n = 13) B cells were analyzed by flow cytometry. (B) The relative activation of p38 MAPK was calculated based on the alteration of phosphorylated MAPKs expression in resting and stimulated naive B cells (stimulated sample MFI/resting sample MFI). Paired Student's t-test was used to assess the differences of phospho-p38 MAPK expression between control and stimulated samples. *p<0.05, **p<0.005, ***p<0.0005.

