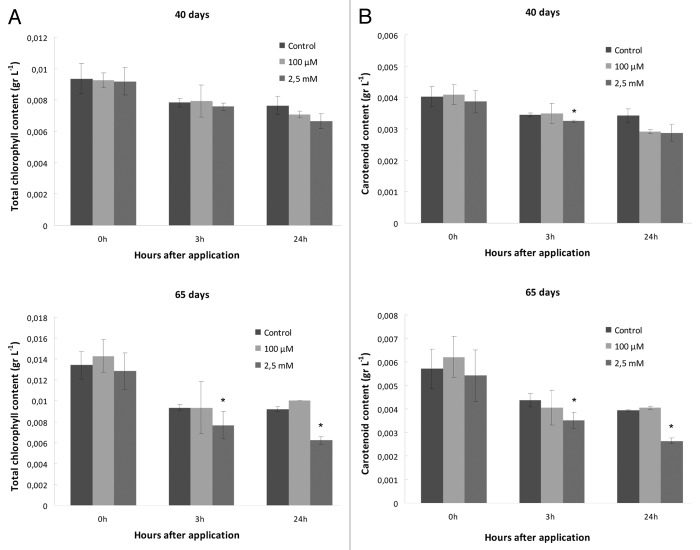
Figure 2. Effect of SNP application on photosynthetic pigment content (A) Τotal chlorophyll (α + β) content, (B) Carotenoid content (where upper rows represent measurements made with 40 d plants, while lower rows indicate measurements made with 65 d plants). Asterisks denote statistically different values according to the Tukey pairwise comparison test (p < 0.05). Values are means ± SE (n = 3).

An official website of the United States government
Here's how you know
Official websites use .gov
A
.gov website belongs to an official
government organization in the United States.
Secure .gov websites use HTTPS
A lock (
) or https:// means you've safely
connected to the .gov website. Share sensitive
information only on official, secure websites.
