
Figure 3. Mean indicated distances in verbal distance estimation, expressed as a percentage of the target distance.
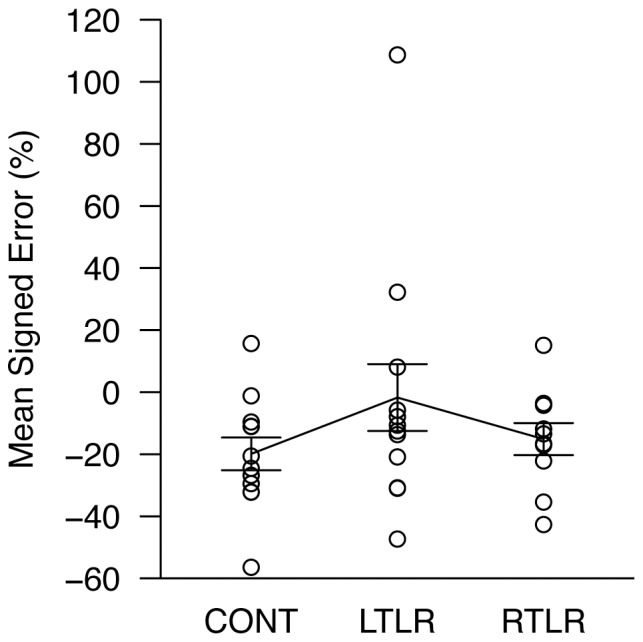
Each data point is the mean response for one participant, collapsed over nine measurements; data for all three participant groups are shown (CONT = age-matched healthy control; LTLR = left temporal lobe resection; RTLR = right temporal lobe resection). The solid line indicates the mean level of performance for each group. Error bars represent ±1 standard error of the mean.