Figure 2. Goodness of fit measures.

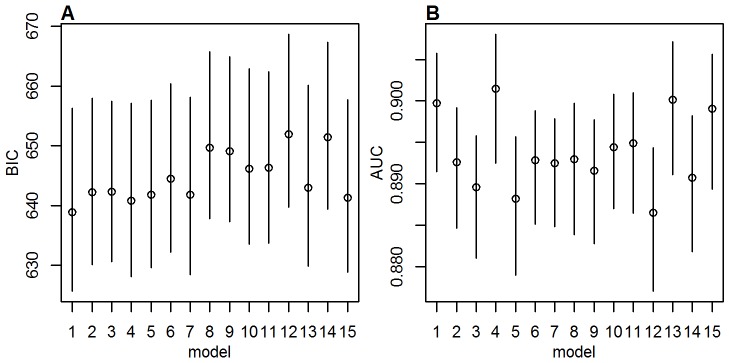
(A) BIC and (B) AUC values for the 15 models investigated with MCMC, with a prior standard deviation on the country factors of 2. Circles show posterior means, lines the 95% posterior range.

(A) BIC and (B) AUC values for the 15 models investigated with MCMC, with a prior standard deviation on the country factors of 2. Circles show posterior means, lines the 95% posterior range.