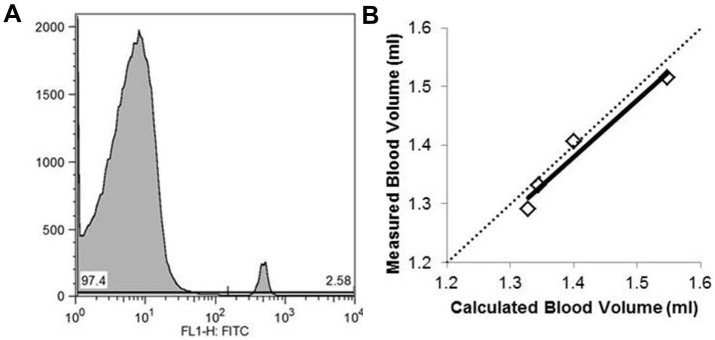
Figure 3. Circulating blood volume.

One hour following the transfusion of biotinylated RBC, the ratio of biotinylated RBCs to native circulating RBCs was determined by flow cytometry (A, representative histogram showing 97.4% non-biotinylated RBC peak on the left and 2.6% biotinylated RBCs on the right). For 4 mice, 200 µL of blood was collected and repeat biotinylated RBC infusion was administered prior to the measurement of post-bleed blood volumes. The measured post-bleed blood volumes closely approximated the values expected based on the amount of blood removed (B, R = 0.98 and slope = 0.97 with dotted line indicating the line of identity).
