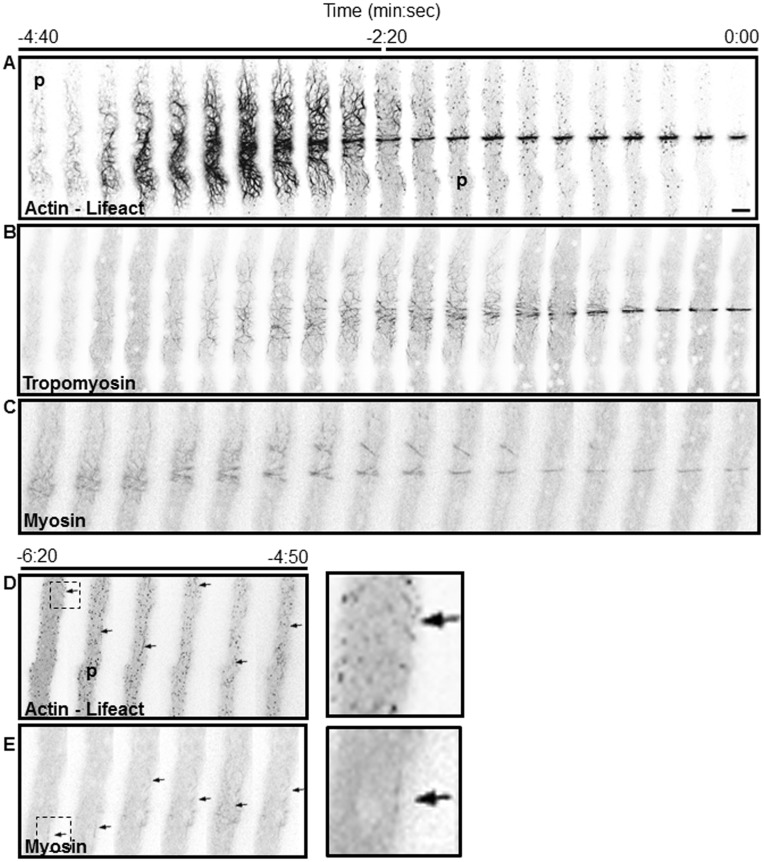
Figure 2. Dynamics of SAT formation and its transition to CAR.
Each panel is a series of images taken at 15(SAT): actin (A and D), tropomyosin (B) and MYO-2 (C and E) and the conversion of SAT to a constriction ring (CAR). Actin, tropomyosin and myosin were imaged near the hyphal cell cortex in the correspondingly tagged strains. Time 0∶00 signals the earliest moment of membrane invagination. SAT assembly reached a peak at −3∶00 min. Note that actin patches (p) in panel A are absent during the SAT stage and begin to appear during CAR formation from time −4∶40 to −2∶20 min. The helicoidal actin cables coalesce to from a proto CAR that is finally assembled into a CAR at approximately −2∶30 min (see Movie S2). Panels (D) and (E) show extended time for actin and myosin, arrows point to the incipient formation of short filaments. The panels on the right in (D) and (E) are enlargements of the areas marked at time −6∶20 min. Scale Bar = 5 µm.

