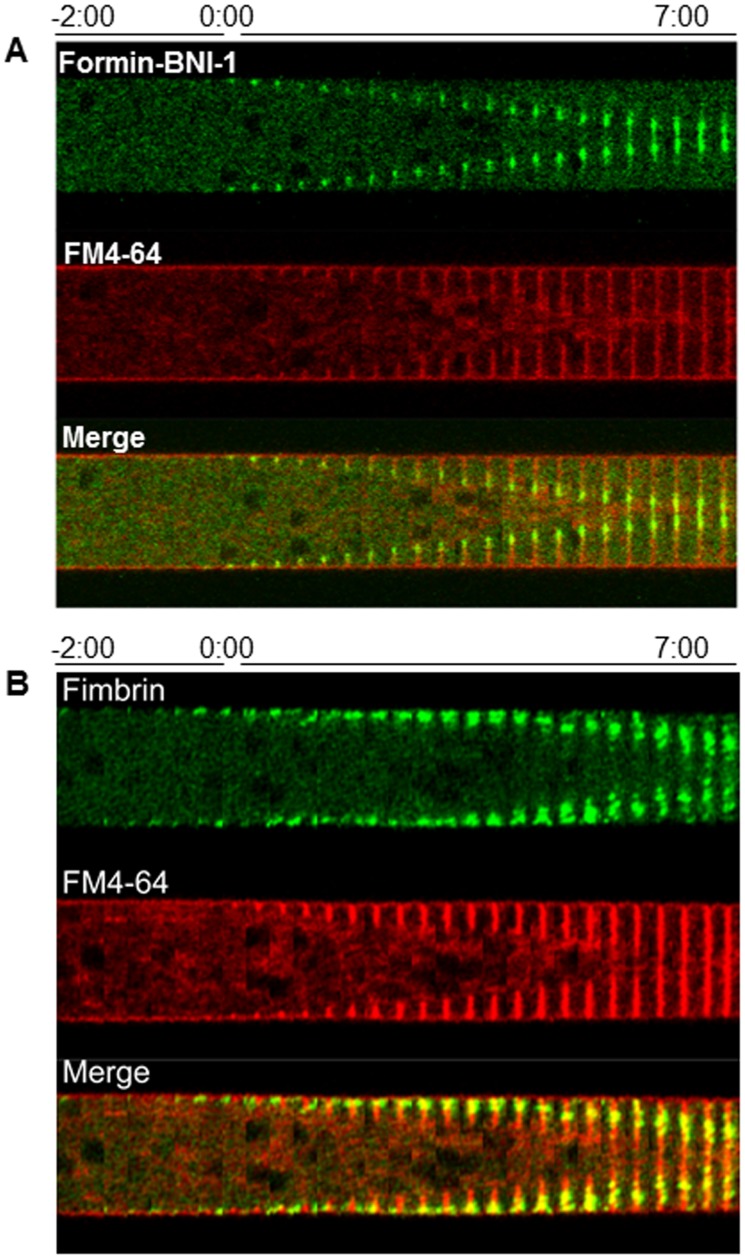
Figure 7. Chronology of the incorporation of Formin BNI-1 (A) and Fimbrin (B) during septum development.
Each kymographic series was constructed from medium plane images taken at 20-64 staining shows the boundaries of the developing septum. Time 0∶00 signals the earliest moment of membrane invagination.

