
Figure 1. Manhattan plot of –log10P-values of the genome-wide association study for the canine hip dysplasia score in German Shepherd Dogs using a mixed linear model analysis.
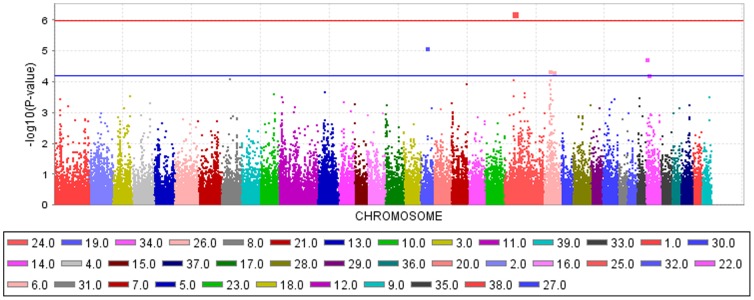
On the X-axis, the SNPs are given by dog chromosome number. The –log10P-values for each SNP genotype effect are plotted against the SNP position on each chromosome. Chromosomes are differentiated by colors. The color keys are given below the plot. The red line indicates a –log10P-value of 4.3 and the blue line indicates the threshold of the –log10P-values for genome-wide significance after correcting for multiple testing.