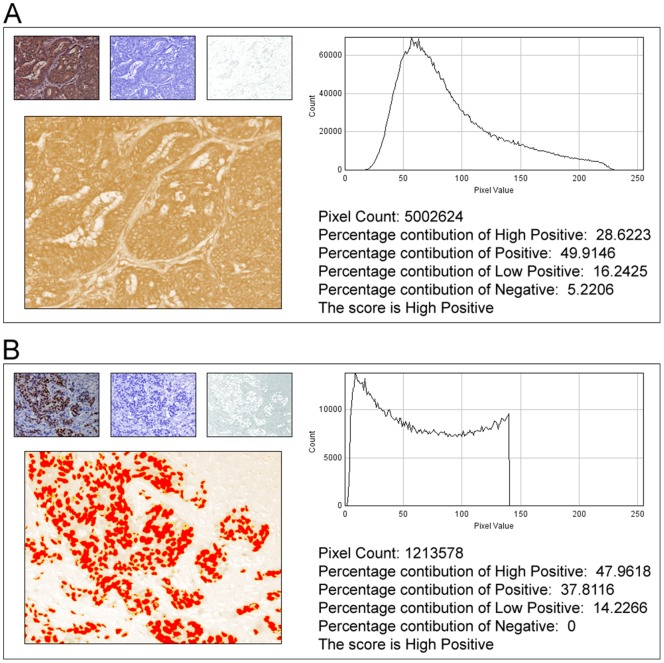
Figure 2. Representative histogram profile and score of a cytoplasmic and nuclear stained image using IHC Profiler.
A: Profiling of the DAB stained cytoplasmic image sample. The histogram profile corresponds to the pixel intensity value vs. corresponding number counts of a pixel intensity. The log given below the histogram profile shows the accurate percentage of the pixels present in each zone of pixel intensity and the respective computed score. B: Profiling of the DAB stained nuclear stained image sample. The red spots on the DAB image indicate the threshold selection of the nucleus areas using the threshold function of ImageJ. The representative histogram profile corresponds to the number of pixels vs. the corresponding value at which the pixel of the respective intensity is present.

