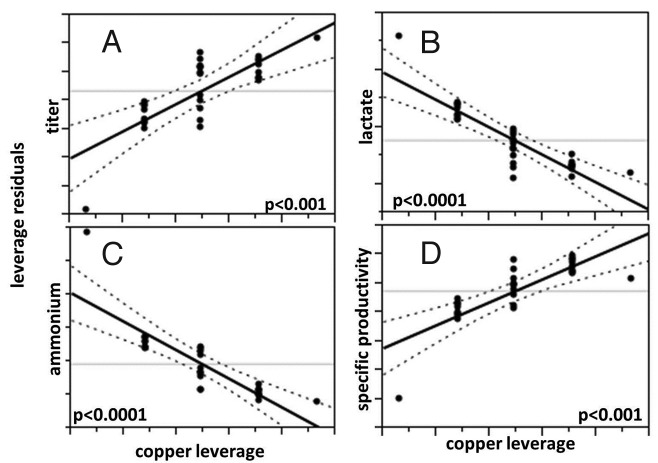
Figure 2. Leverage plots demonstrating the effect of copper concentration on final titer (A), final lactate (B), final ammonium (C), and average specific productivity (D) in medium component screen shake flask cultures. Solid black: line of fit; dotted black: confidence lines (α = 0.05); and gray: mean of Y leverage residuals.

An official website of the United States government
Here's how you know
Official websites use .gov
A
.gov website belongs to an official
government organization in the United States.
Secure .gov websites use HTTPS
A lock (
) or https:// means you've safely
connected to the .gov website. Share sensitive
information only on official, secure websites.
