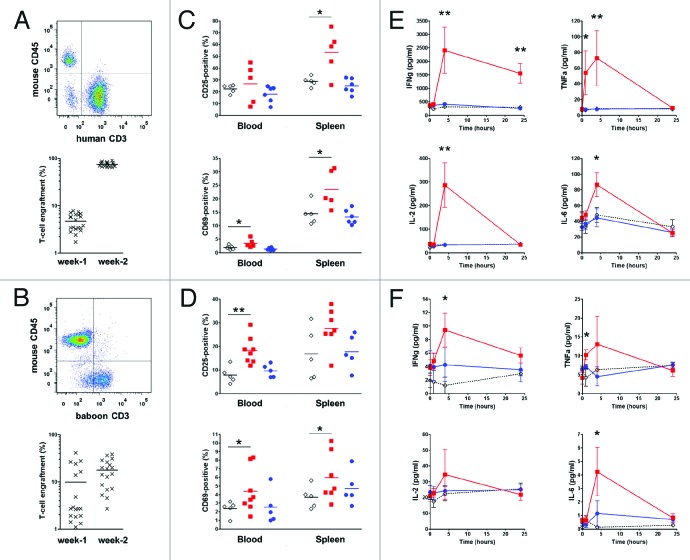
Figure 4.In vivo stimulation of human or baboon PBMC with anti-CD28 mAbs in NSG mice. One representative flow cytometry analysis (upper panel) and quantification of engraftment (low panel) of (A) human (n = 20) and (B) baboon (n = 18) cells in NSG mice two weeks after PBMC transfer. Each mark represents an individual mouse. (C, D) Percentage of activated human and baboon T lymphocytes expressing CD25 and CD69 among CD3+ cells in recipient blood and spleen 48 h after drug injection. Two weeks after PBMC transfer, mice received either 50 µg i.p. of superagonist anti-CD28 ANC28.1 mAb (red square symbols; n = 5 for human and n = 7 for baboon), 150 µg of humanized pegylated Fab’ fragment FR104 (blue dots; n = 6 for human and n = 5 for baboon) or an equivalent volume of excipient (open diamond; n = 5 for human and baboon). Each symbol represents an individual mouse. Horizontal bars indicate the mean. (E) Human and (F) baboon cytokine release after treatment in same experiments as in C and D; data are means ± SEM.*P < 0.05 and **P < 0.01 compared with control conditions. Cumulative data were obtained from three independent series of experiments using three different human and three baboon blood donors.

An official website of the United States government
Here's how you know
Official websites use .gov
A
.gov website belongs to an official
government organization in the United States.
Secure .gov websites use HTTPS
A lock (
) or https:// means you've safely
connected to the .gov website. Share sensitive
information only on official, secure websites.
