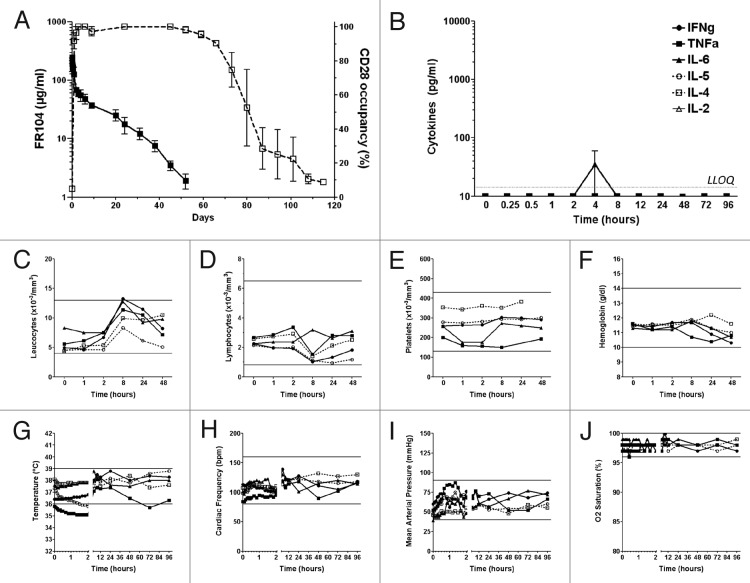
Figure 5.Immunotoxicity evaluation of FR104 after intravenous injection in baboon. (A) Serum concentration (black square; left y-axis) of FR104 and receptor occupancy (open square; right y-axis) on blood T lymphocytes measured by flow cytometry after a single intravenous administration at 20 mg/kg in three different baboons. Data are mean ± SEM (B) Serum concentration of indicated cytokines measured after FR104 injection in the three animals described in (A). Data are mean ± SEM. Dotted line represents the highest lower limit of quantification (LLOQ). (C) leukocytes count, (D) lymphocytes count, (E) platelets count, (F) hemoglobin count, (G) body temperature, (H) cardiac frequency, (I) mean arterial pressure and(J) oxygen saturation recorded after FR104 injection in the three animals described in (A; black symbols and solid lines) as well as in two other excipient-treated baboons (open symbols and dotted lines). Each animal is represented by a different symbol. The horizontal lines indicate the range of normal values in baboons.39

An official website of the United States government
Here's how you know
Official websites use .gov
A
.gov website belongs to an official
government organization in the United States.
Secure .gov websites use HTTPS
A lock (
) or https:// means you've safely
connected to the .gov website. Share sensitive
information only on official, secure websites.
