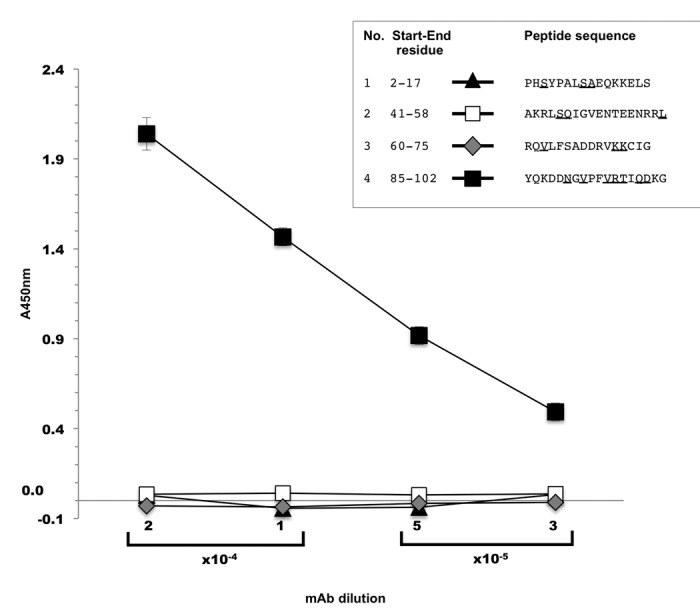
Figure 4. ELISA screening of biotinylated aldolase C peptides. Four different mAb dilution factors were tested in the experiment (1:5,000; 1:10,000; 1:20,000; 1:40,000). X axis, mAb dilution factors; Y axis, absorbance values measured at 450 nm. The marker styles of the four test peptides are indicated in the figure inset together with their amino acid sequence. Underlined letters indicate aldolase C isoenzyme sequence-specific residues as compared with human aldolase A and B. Values are the mean ± SD of duplicate samples and are representative of three independent experiments.
