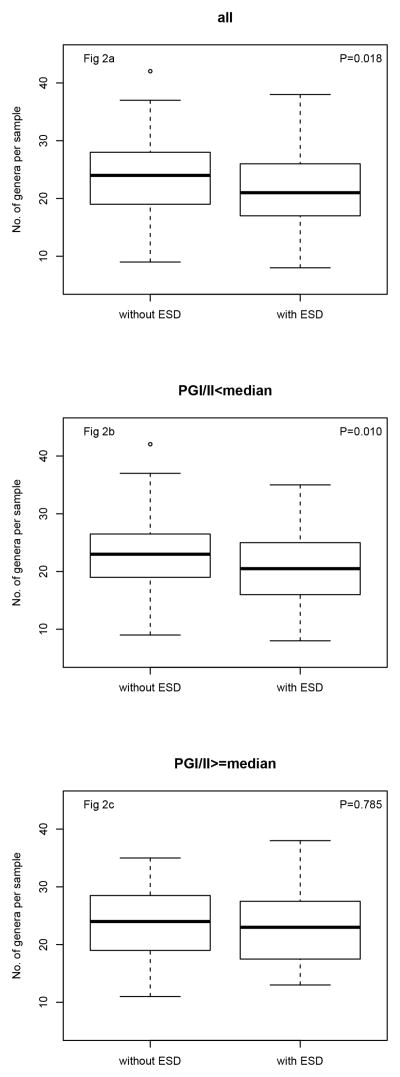
Figure 2.
Boxplots of ESD status and number of genera per sample in all studied subjects (Fig 2a), subjects with PGI/II less than median (Fig 2b), subjects with PGI/II equal or greater than median (Fig 2c). Boxes encompass the interquartile range (IQR), with central bars for medians and whiskers for 1.5-times the IQR. Outlier values are circles. P values were from the adjusted logistic regression models.

